
Where is growth coming from?
Connect acquisition, conversion, revenue and refunds in a five-page Power BI report.
Power BI · 5 report views
Explore the case Portfolio demo · Public sample data · Not client results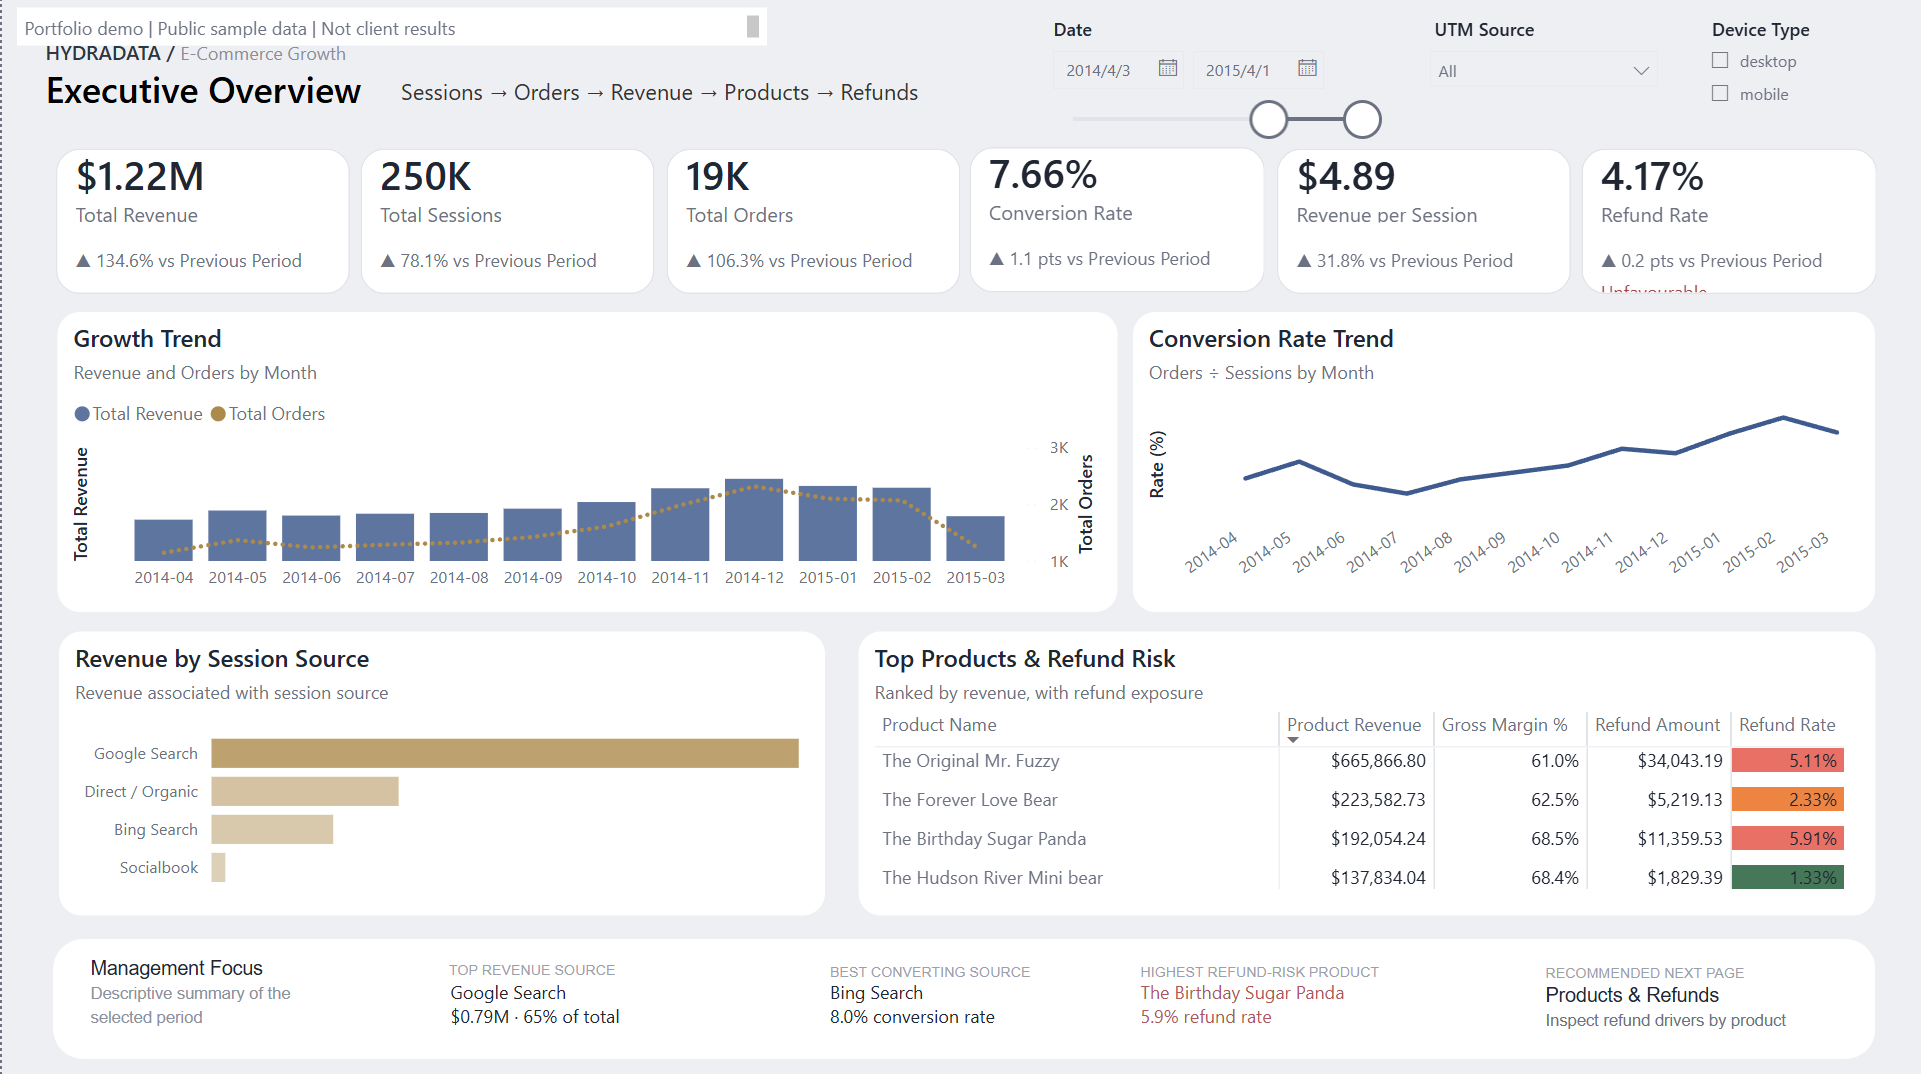
See how data modelling, reporting and business context come together. Choose a question close to yours.
These are portfolio demonstrations using public sample or synthetic data. They show our approach and implementation, not client results.
Connect acquisition, conversion, revenue and refunds in a five-page Power BI report.
Power BI · 5 report views
Explore the case Portfolio demo · Public sample data · Not client resultsReview opportunities, team performance and CRM data quality to prepare the next follow-up.
Power BI · 3 report views
Explore the case Portfolio demo · Synthetic data · Not client results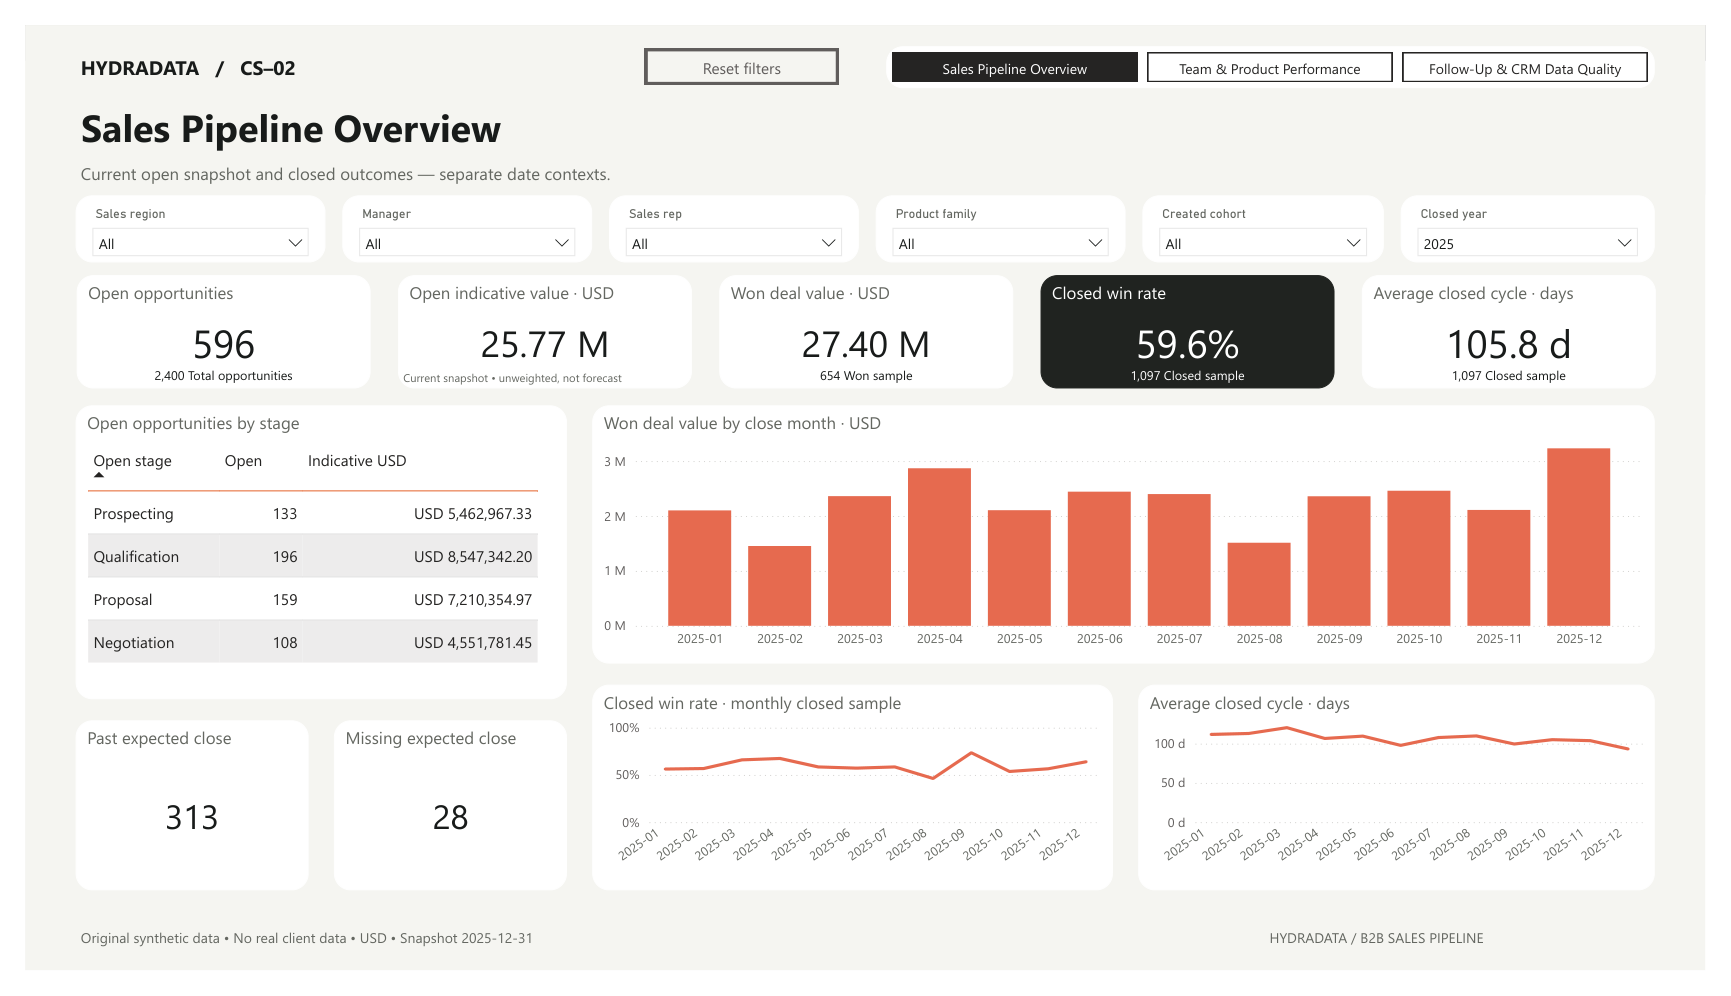
Compare planned and good output, then explore recorded downtime and delayed work orders.
Power BI · 2 report views
Explore the case Portfolio demo · Synthetic data · Not client results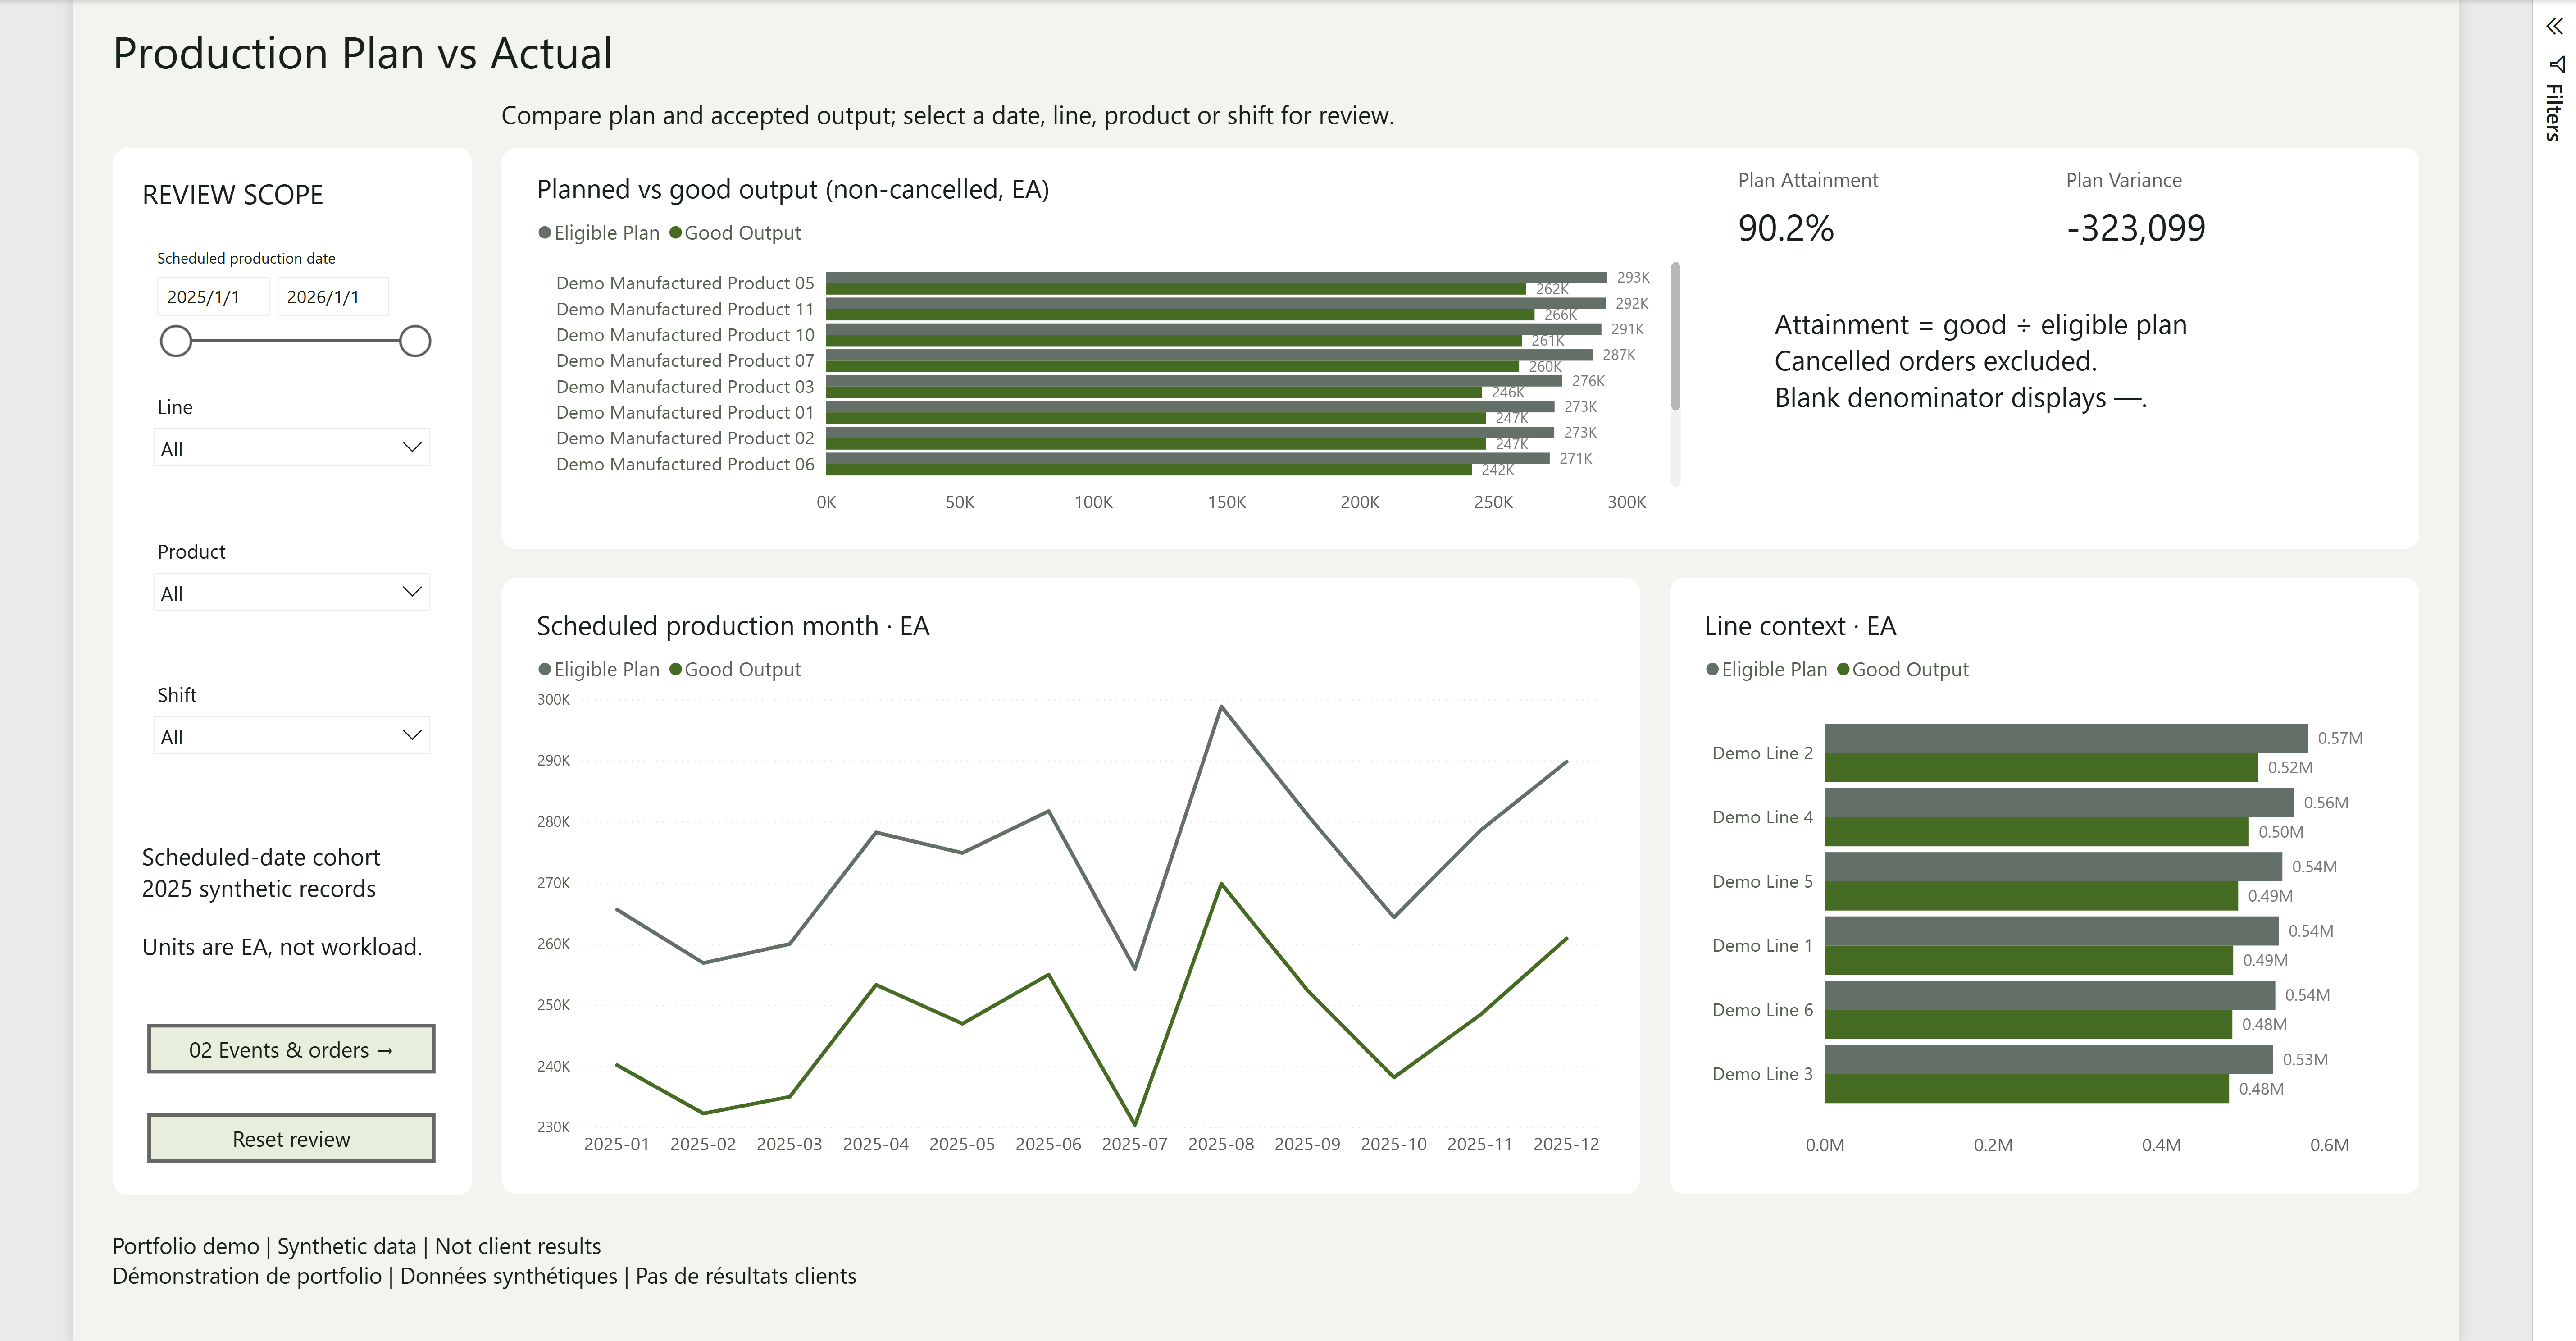
Read receivables by age and use recorded follow-up context to prepare the next action.
Power BI · 2 report views
Explore the case Portfolio demo · Synthetic data · Not client results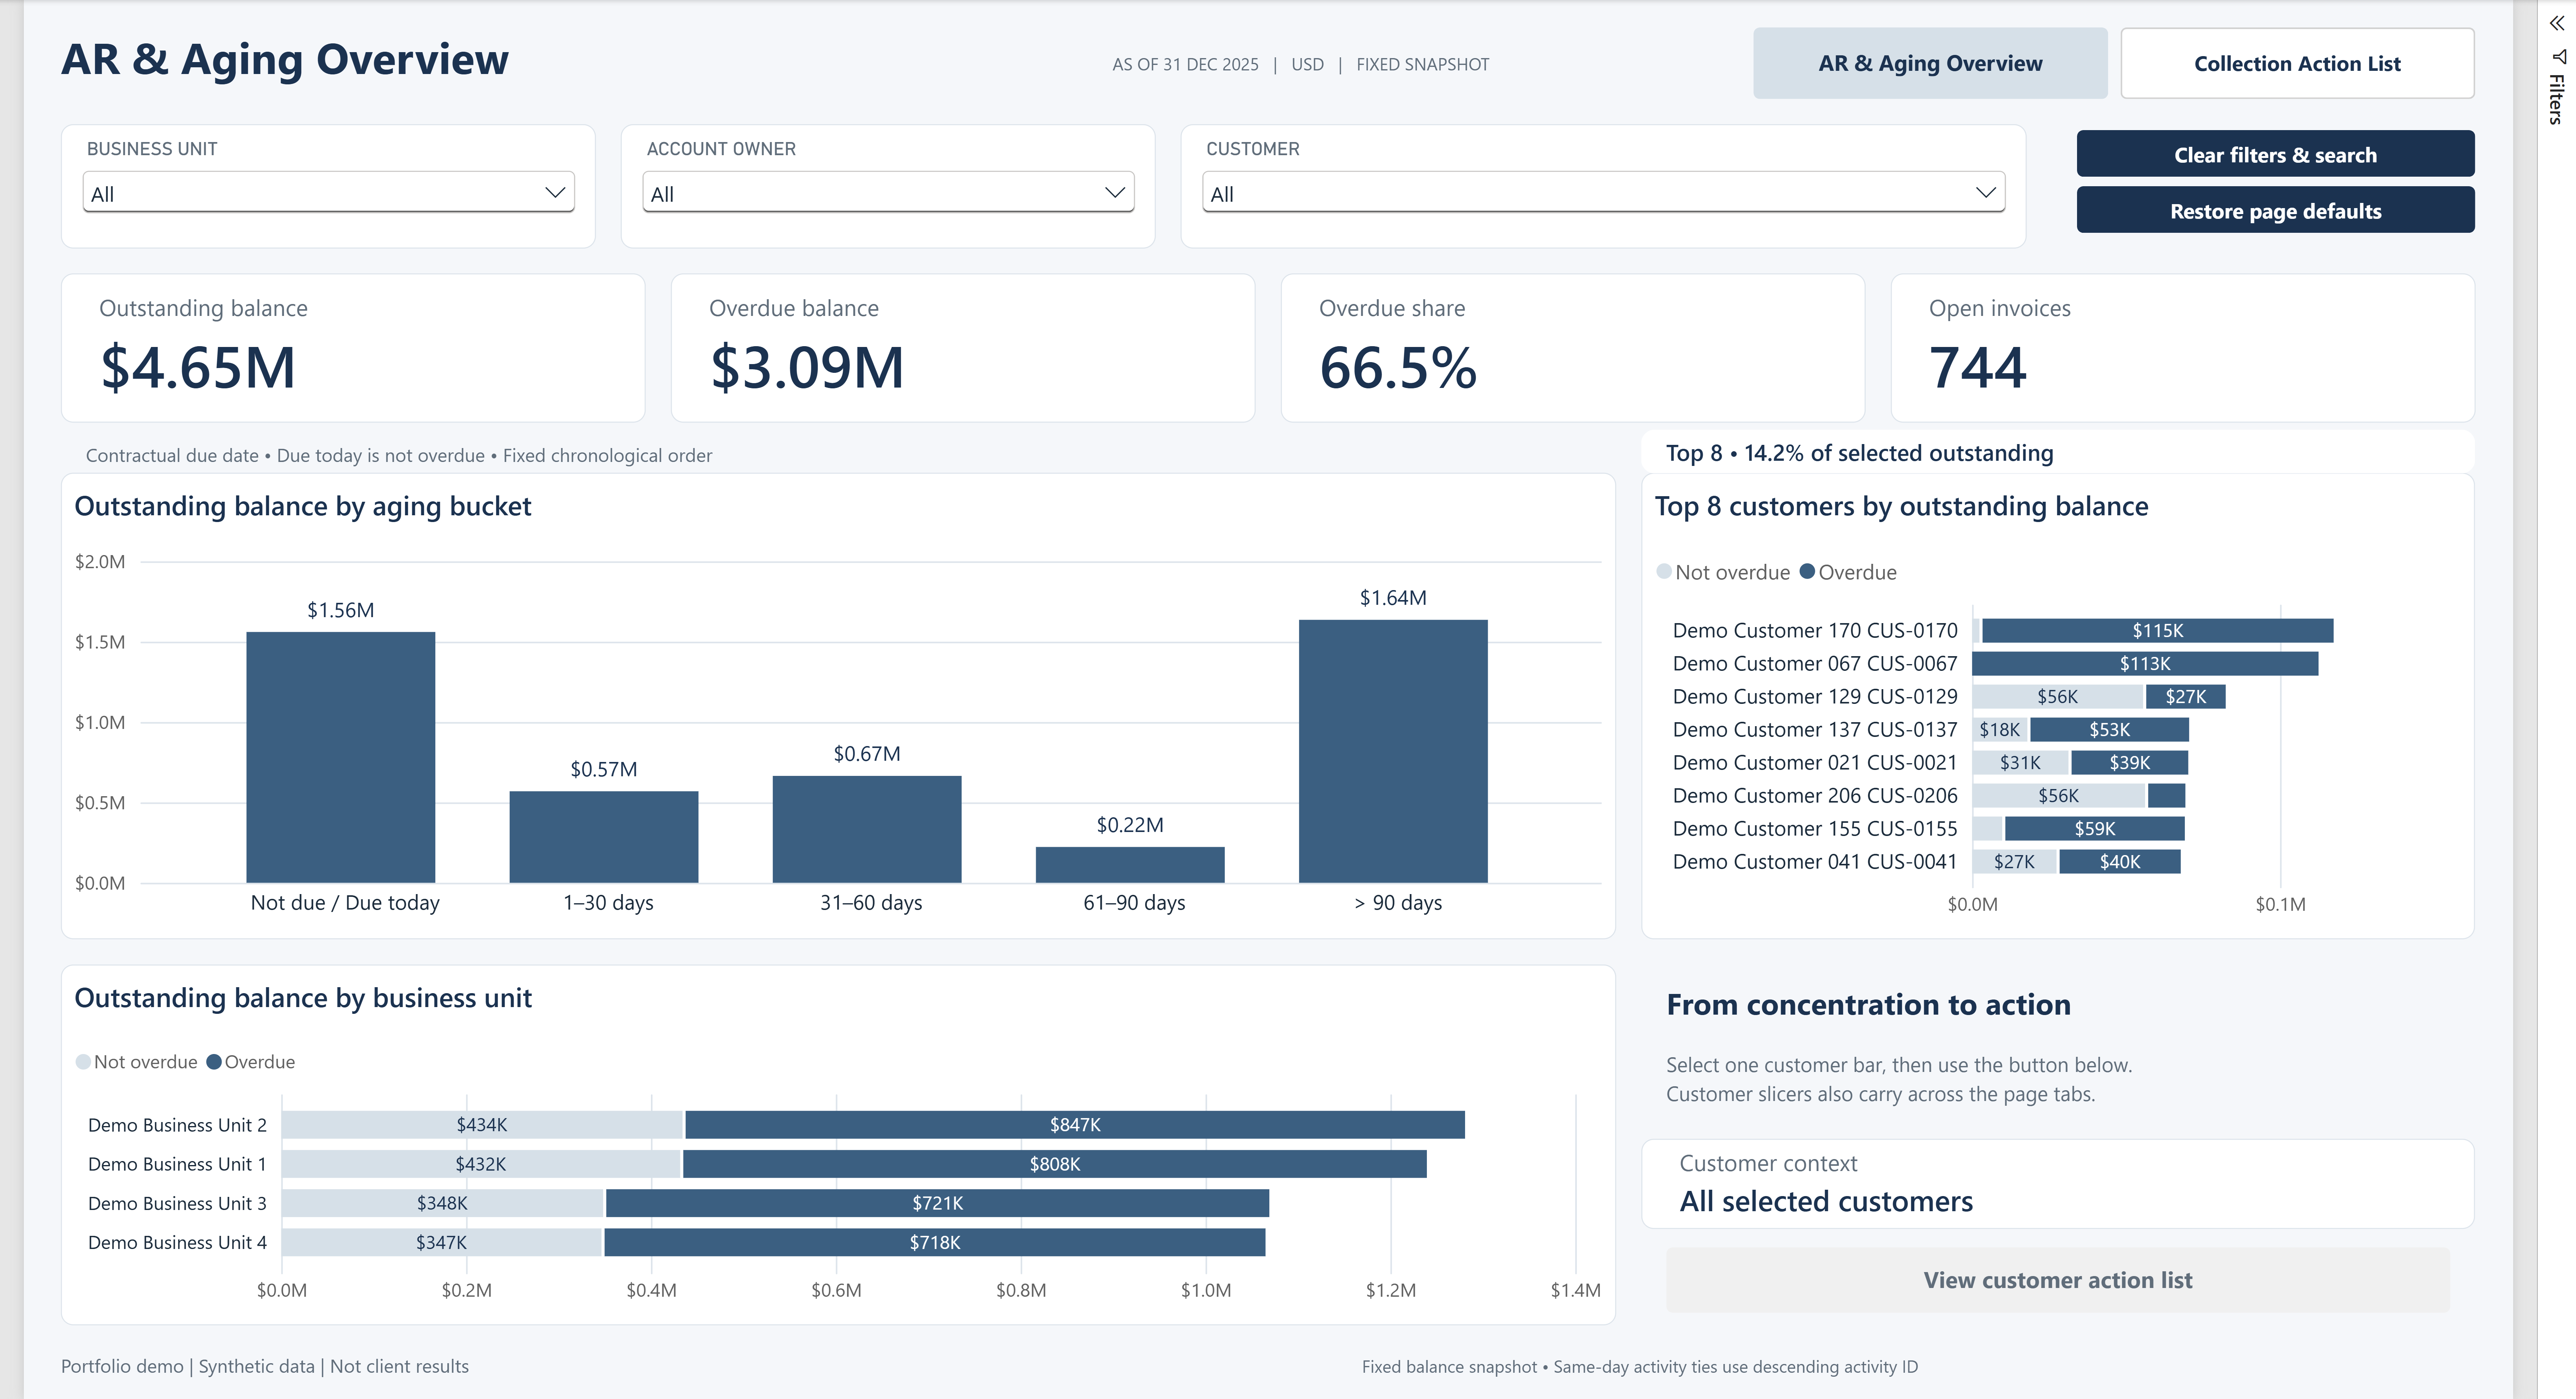
Bring your reporting challenge. We’ll help you work out a practical starting point.
Discuss your project